Establishing the foundation of Jira’s reporting journey with1.2 million views
Problem
Reimagining the reporting journey
Teams lacked a single, reliable location within Jira to track project health. To gain a clear picture of progress, users were forced to build manual dashboards in external tools or export data. This fragmented process not only wasted time but created dangerous visibility gaps, often resulting in missed risks and delayed deadlines because the data wasn't where the work was happening.
Constraints
Reporting in different place but nothing quite rightDesigning the Summary View was a high-stakes coordination effort, positioned at the intersection of three major technical and visual shifts:
The Jira Visual Refresh
Aligning with a new, platform-wide aesthetic.
The Visualisation Platform
Adopting standardised components for data rendering across Atlassian.
Global Alignment
Ensuring the experience felt cohesive with other fixed dashboards across the entire Atlassian suite.
approach
Stakeholder management is key
The process moved through a rigorous cycle from competitor analysis and research synthesis to leadership design reviews. Because this project involved so many moving parts, constant sparring was essential to keep stakeholders aligned on the direction.
Intentional Visual Hierarchy
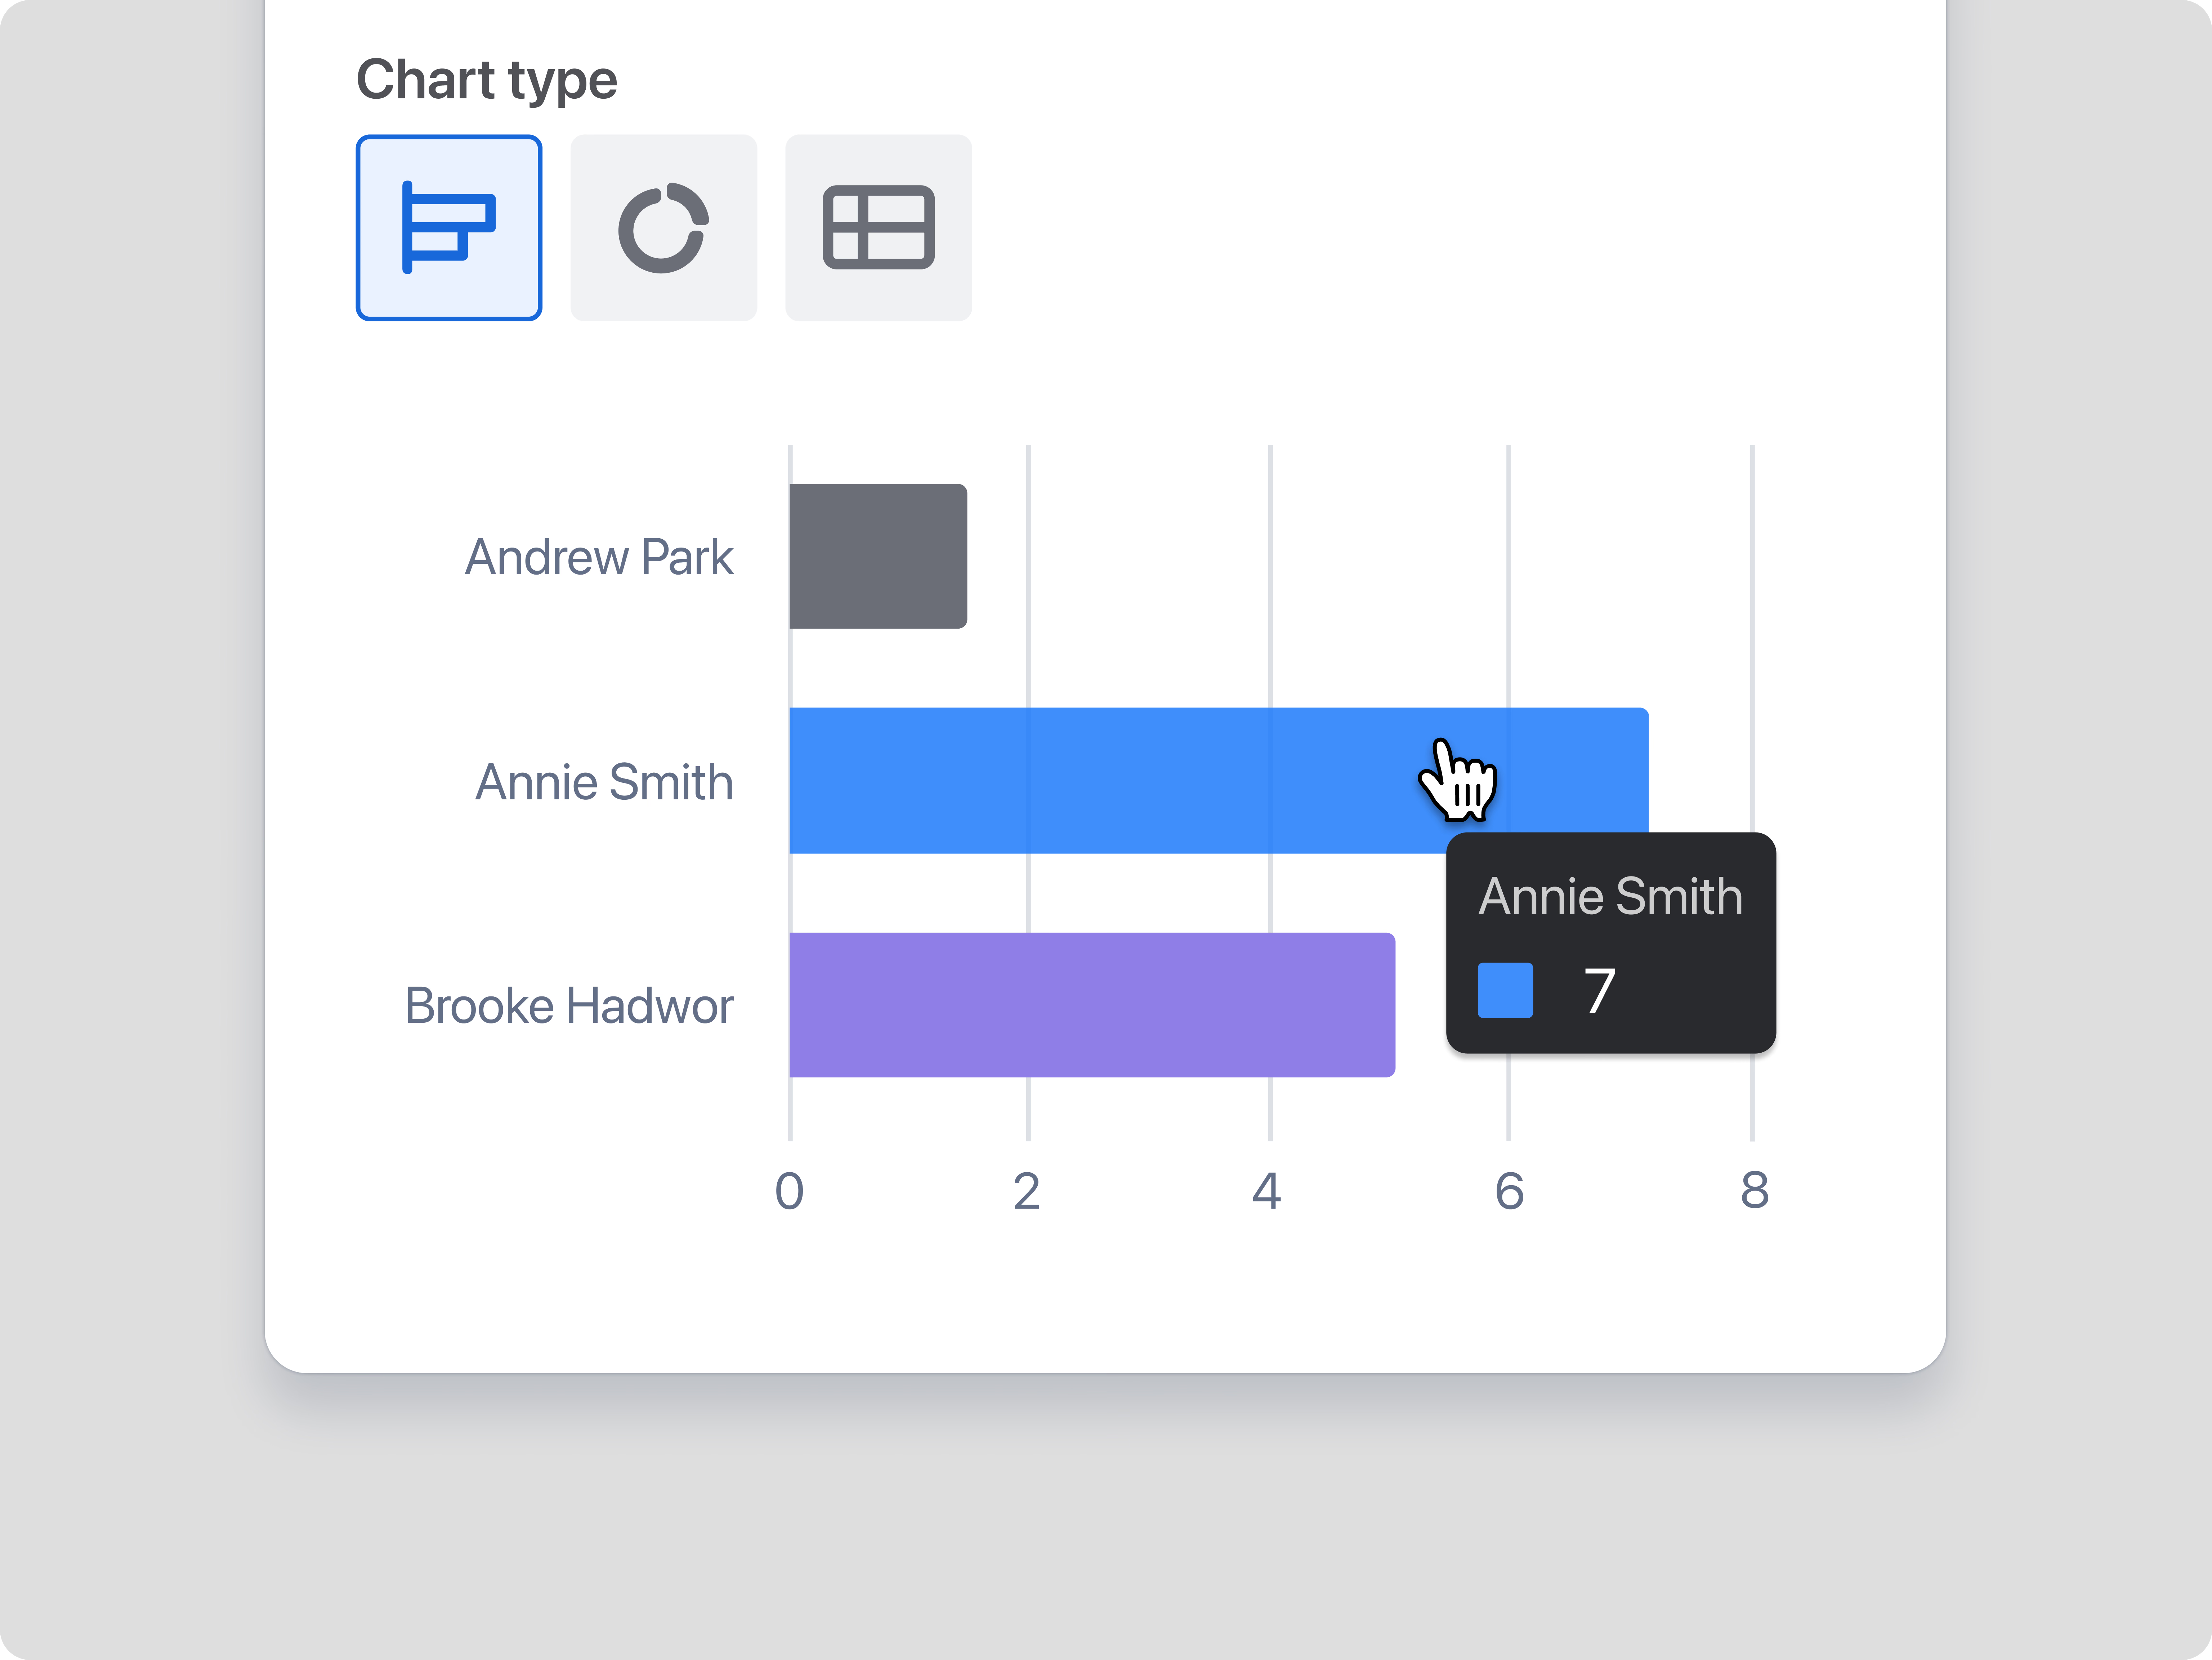
We introduced a "gray-by-default" principle for charts. While this faced initial internal pushback, it was a deliberate design choice. By using gray as the baseline, we ensured that color was intentional when used.
Foundational Customisation
While customers requested full dashboard customisation, we framed this version as the essential foundation. It was designed as the first step in a larger vision for flexible data experiences across the product.
Validation through Adoption
Research confirmed that while users weren't necessarily commenting more, they were adopting the view as their primary source of truth. The data showed that users were finally finding the insights they needed to inform their projects quickly.
Solution
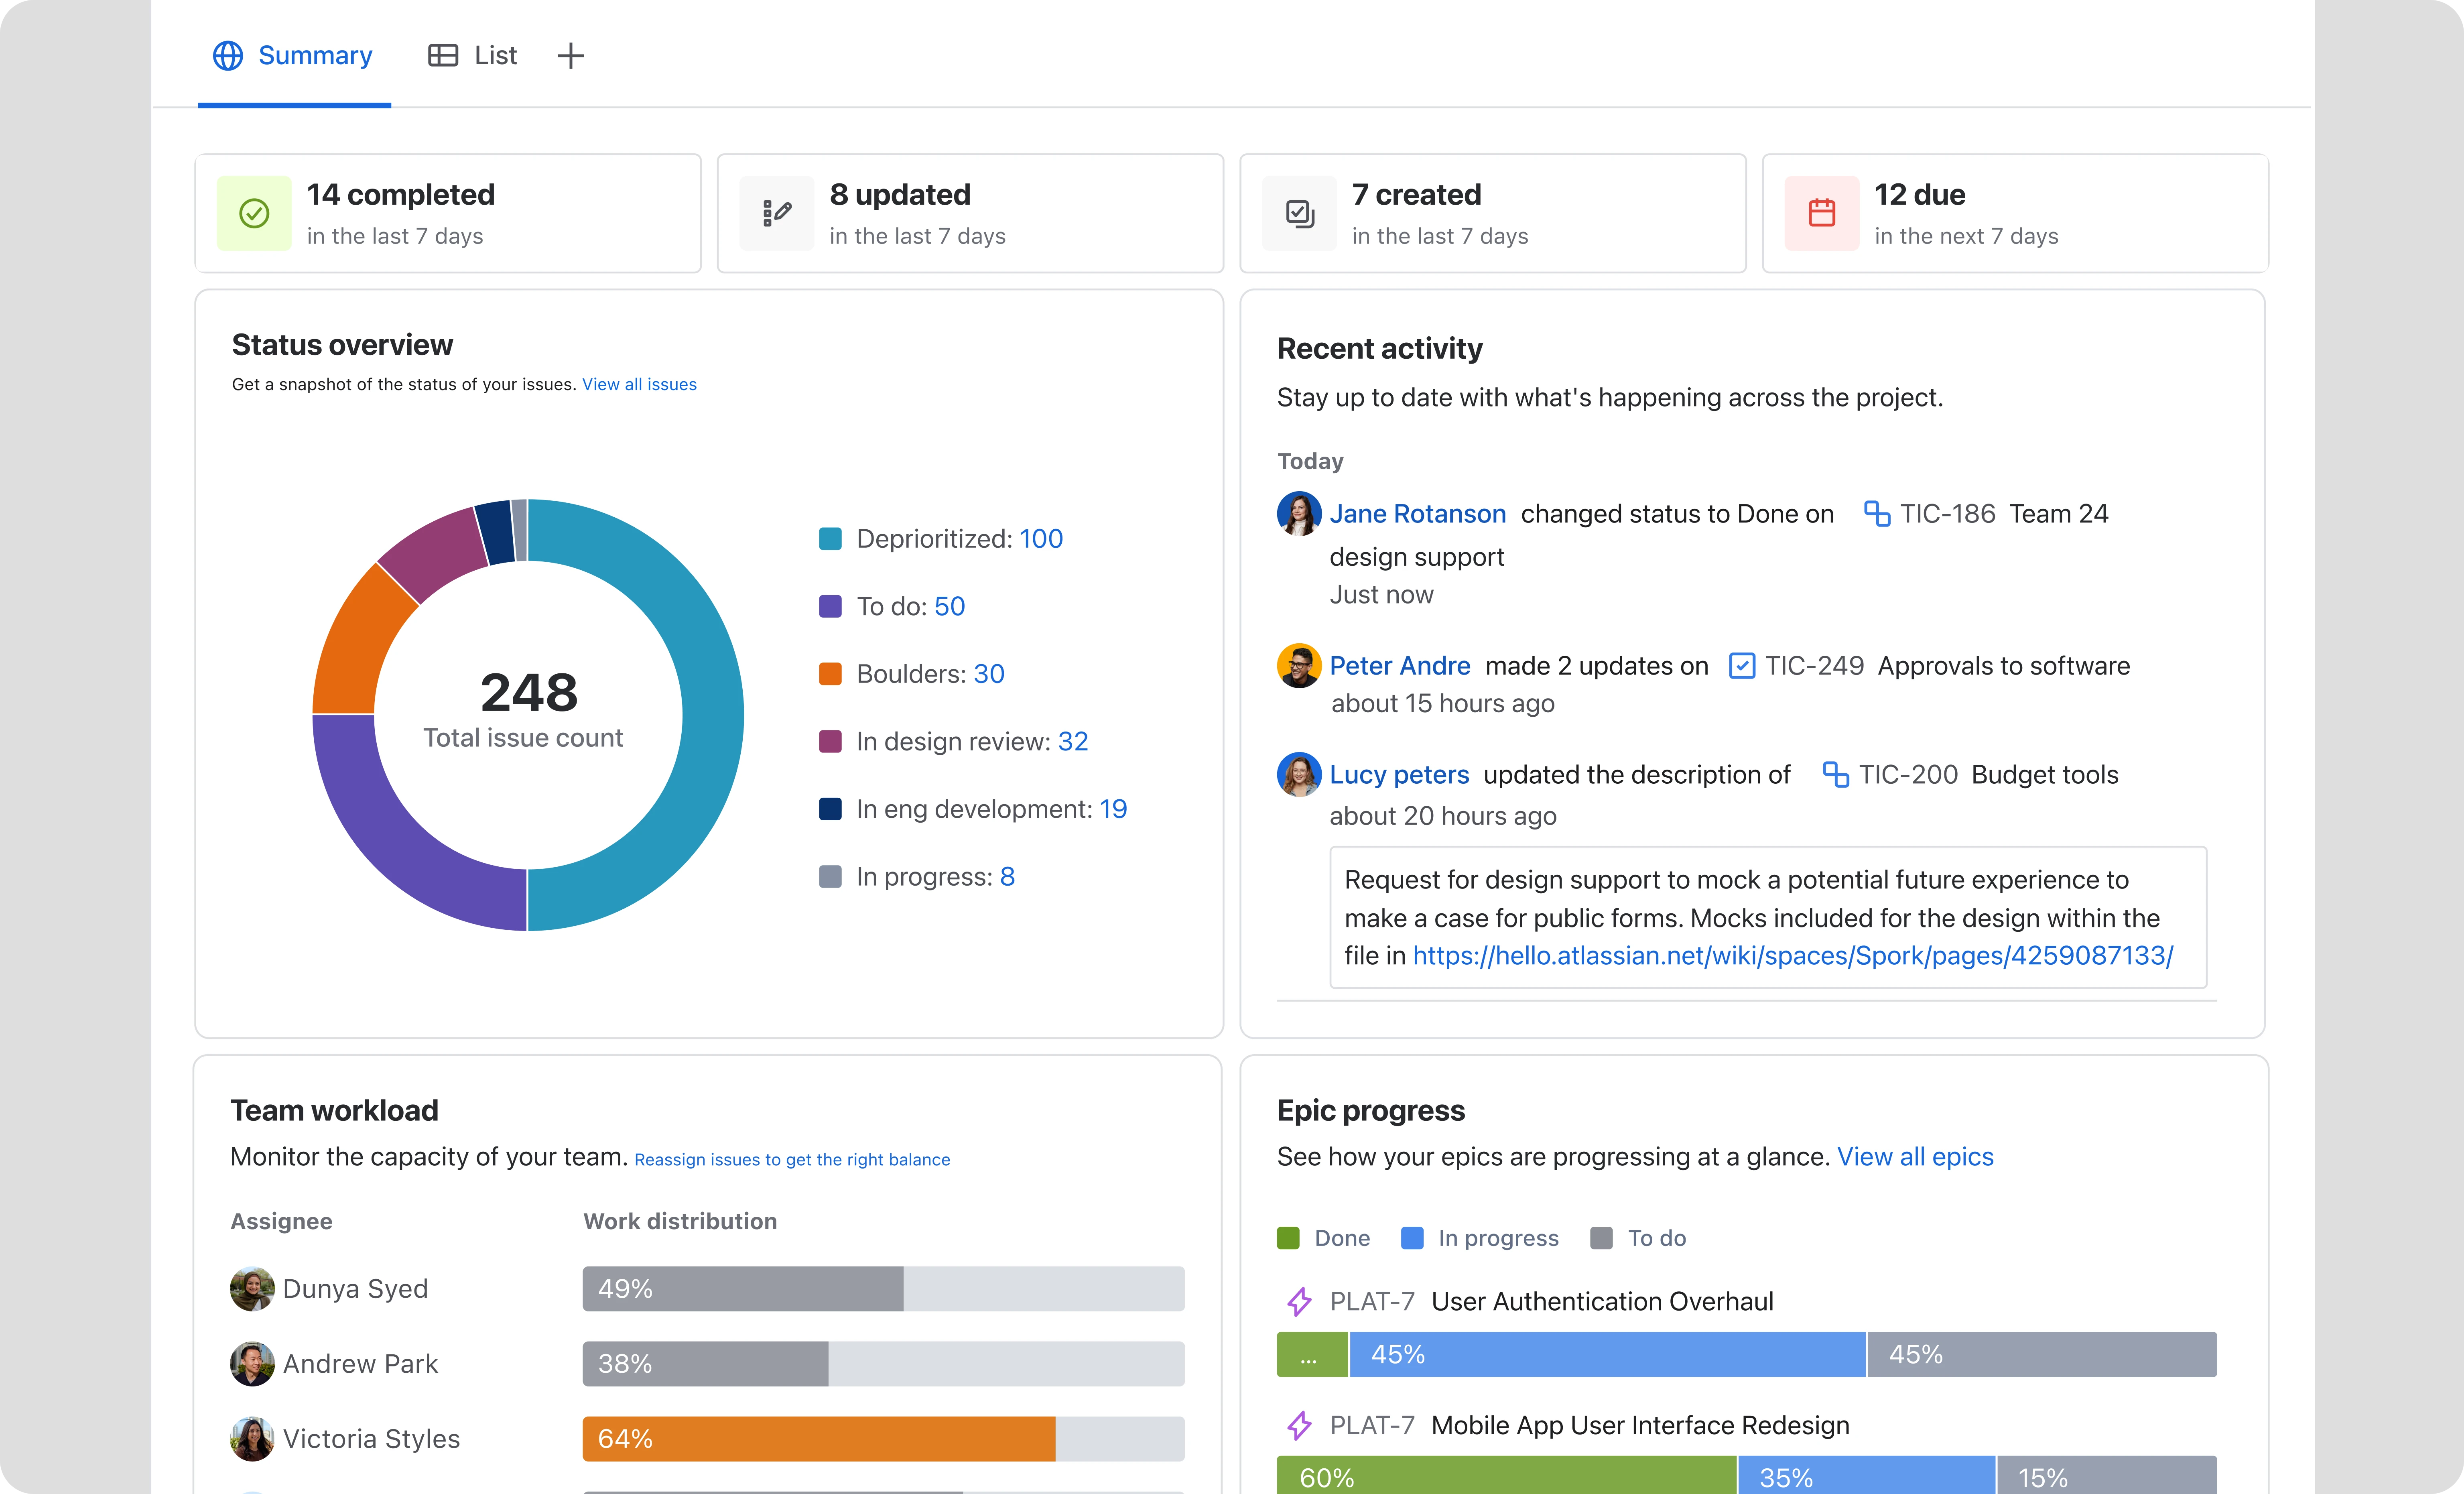
Universal widgets
These widgets provide a quick health check for every project type, surfacing Epic and velocity to deliver a snapshot of the project.
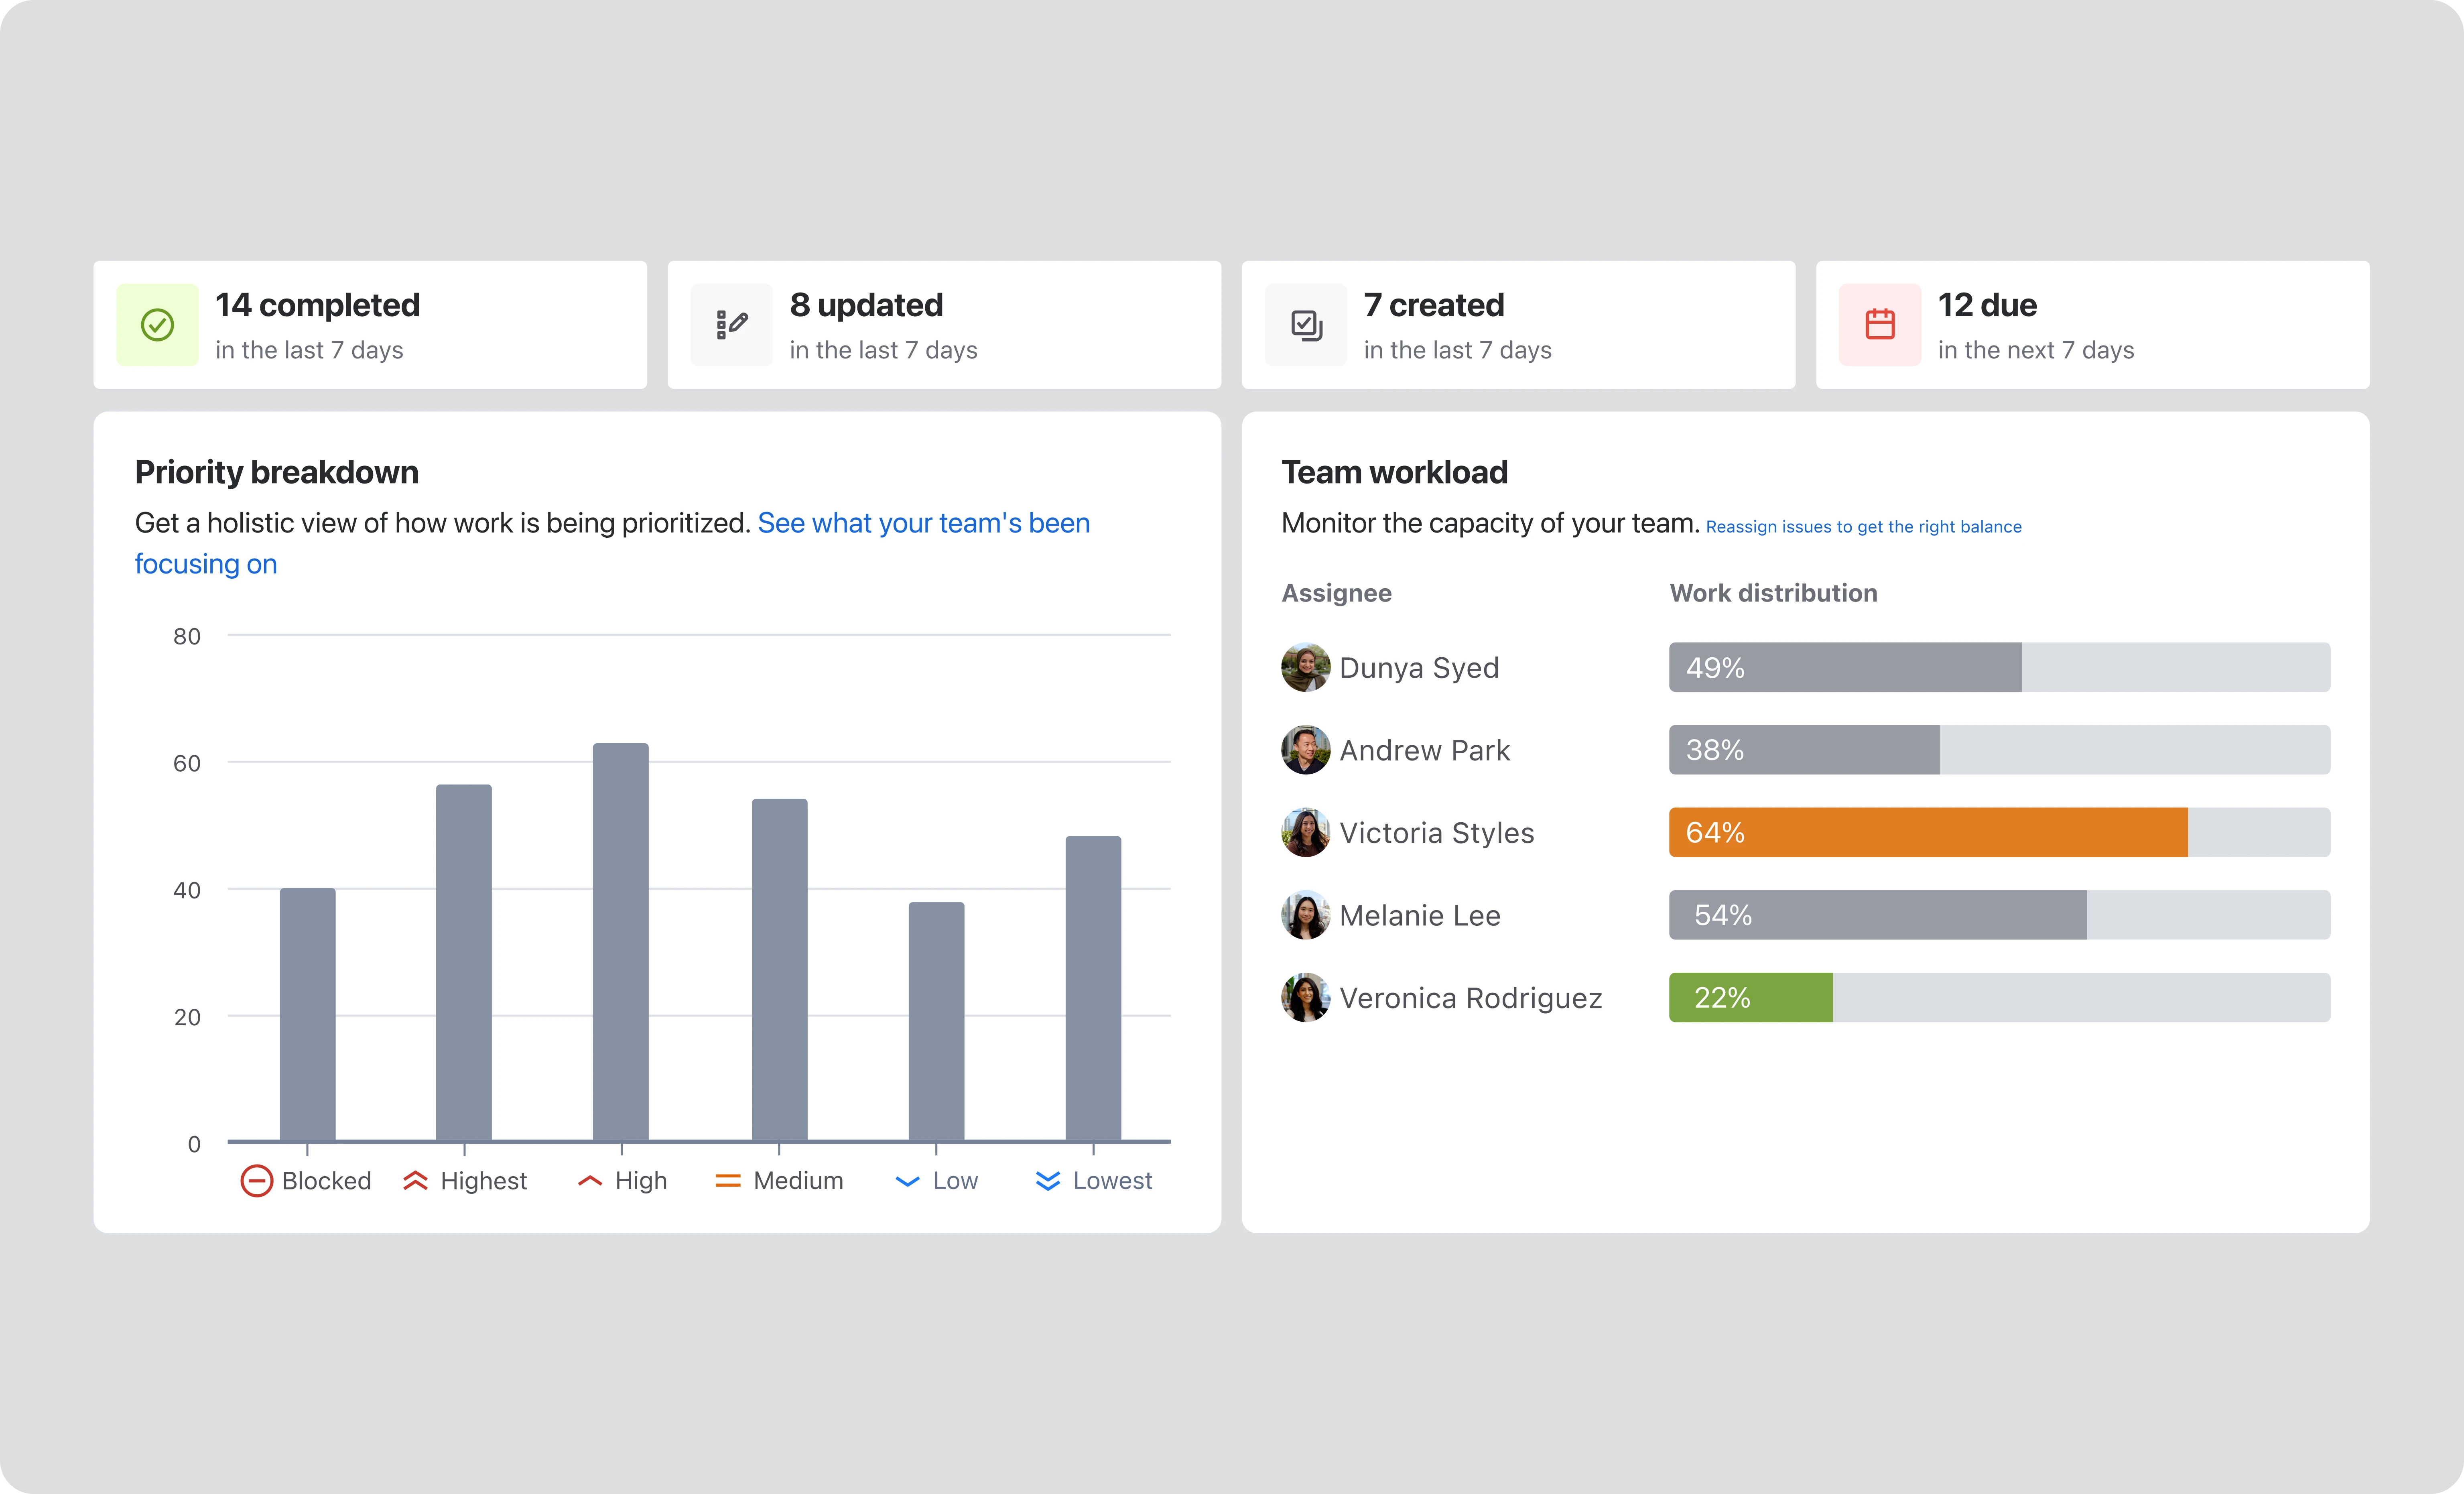
Identify possible problems
Users can move instantly from a high-level pulse check into the list view whenever they need to dive deep into the details.
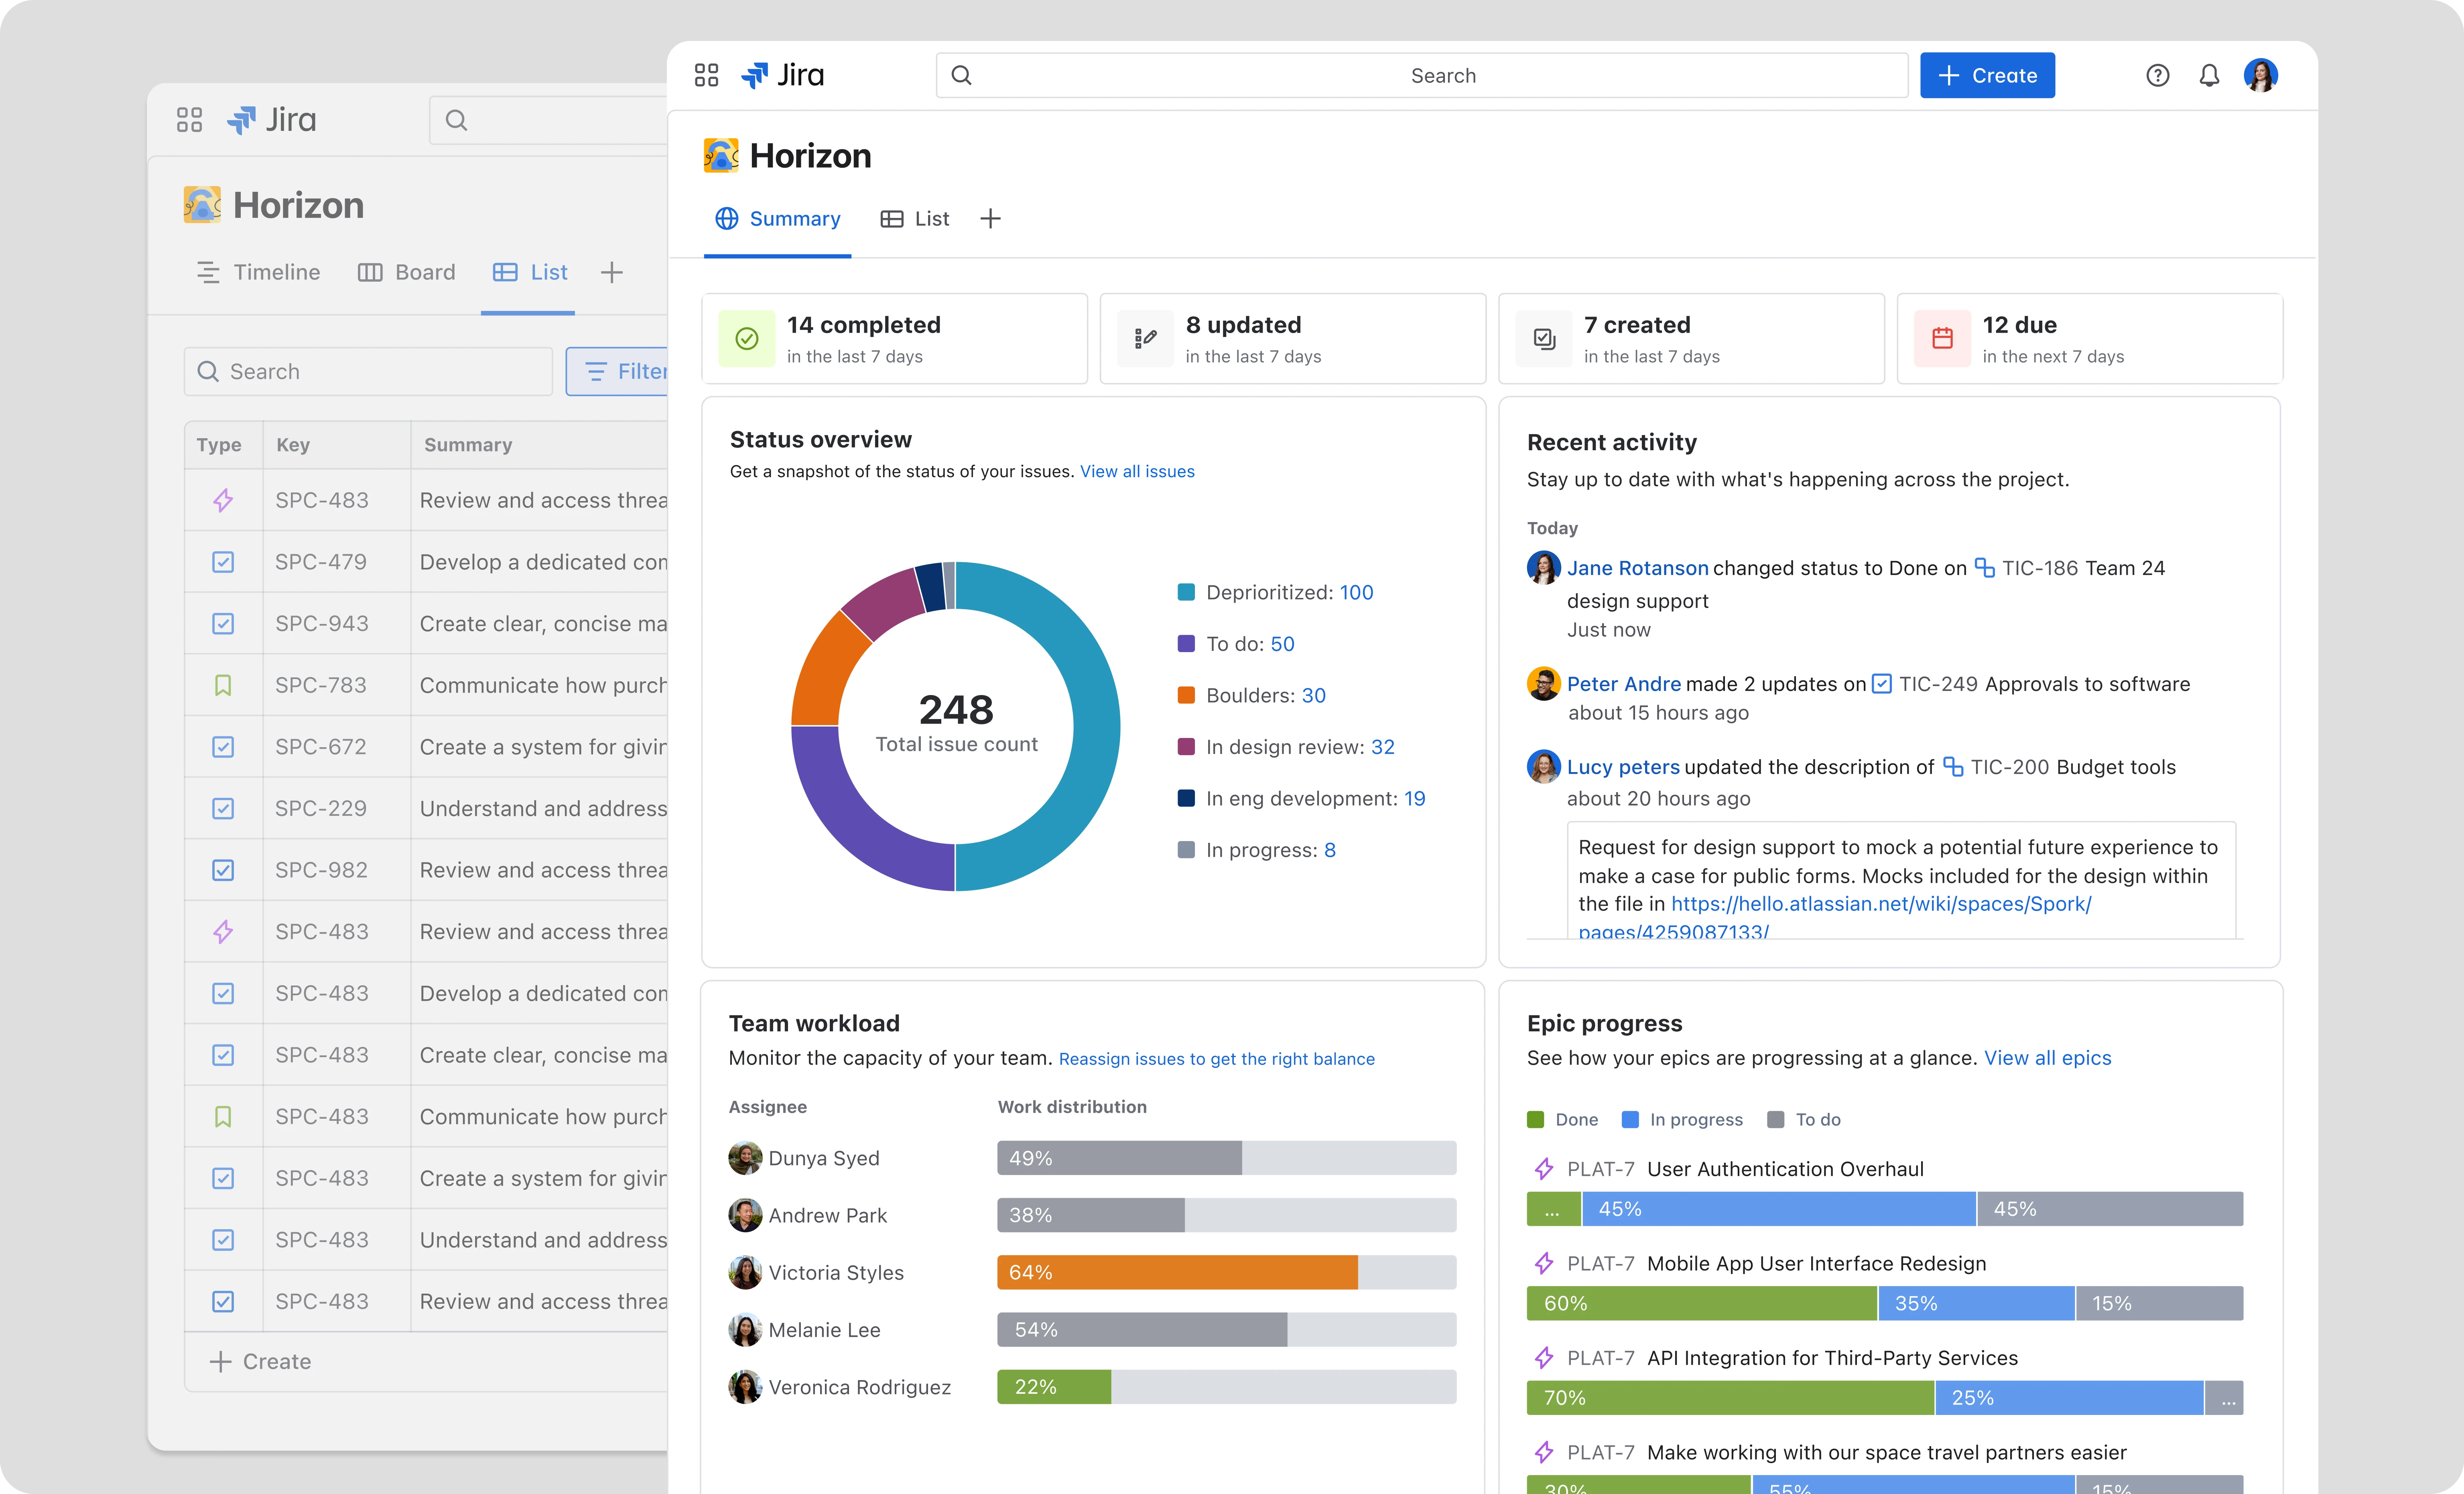
Minimal design and scalability
The Visual refresh improved readability, simplified the hierarchy, and supports scalability.
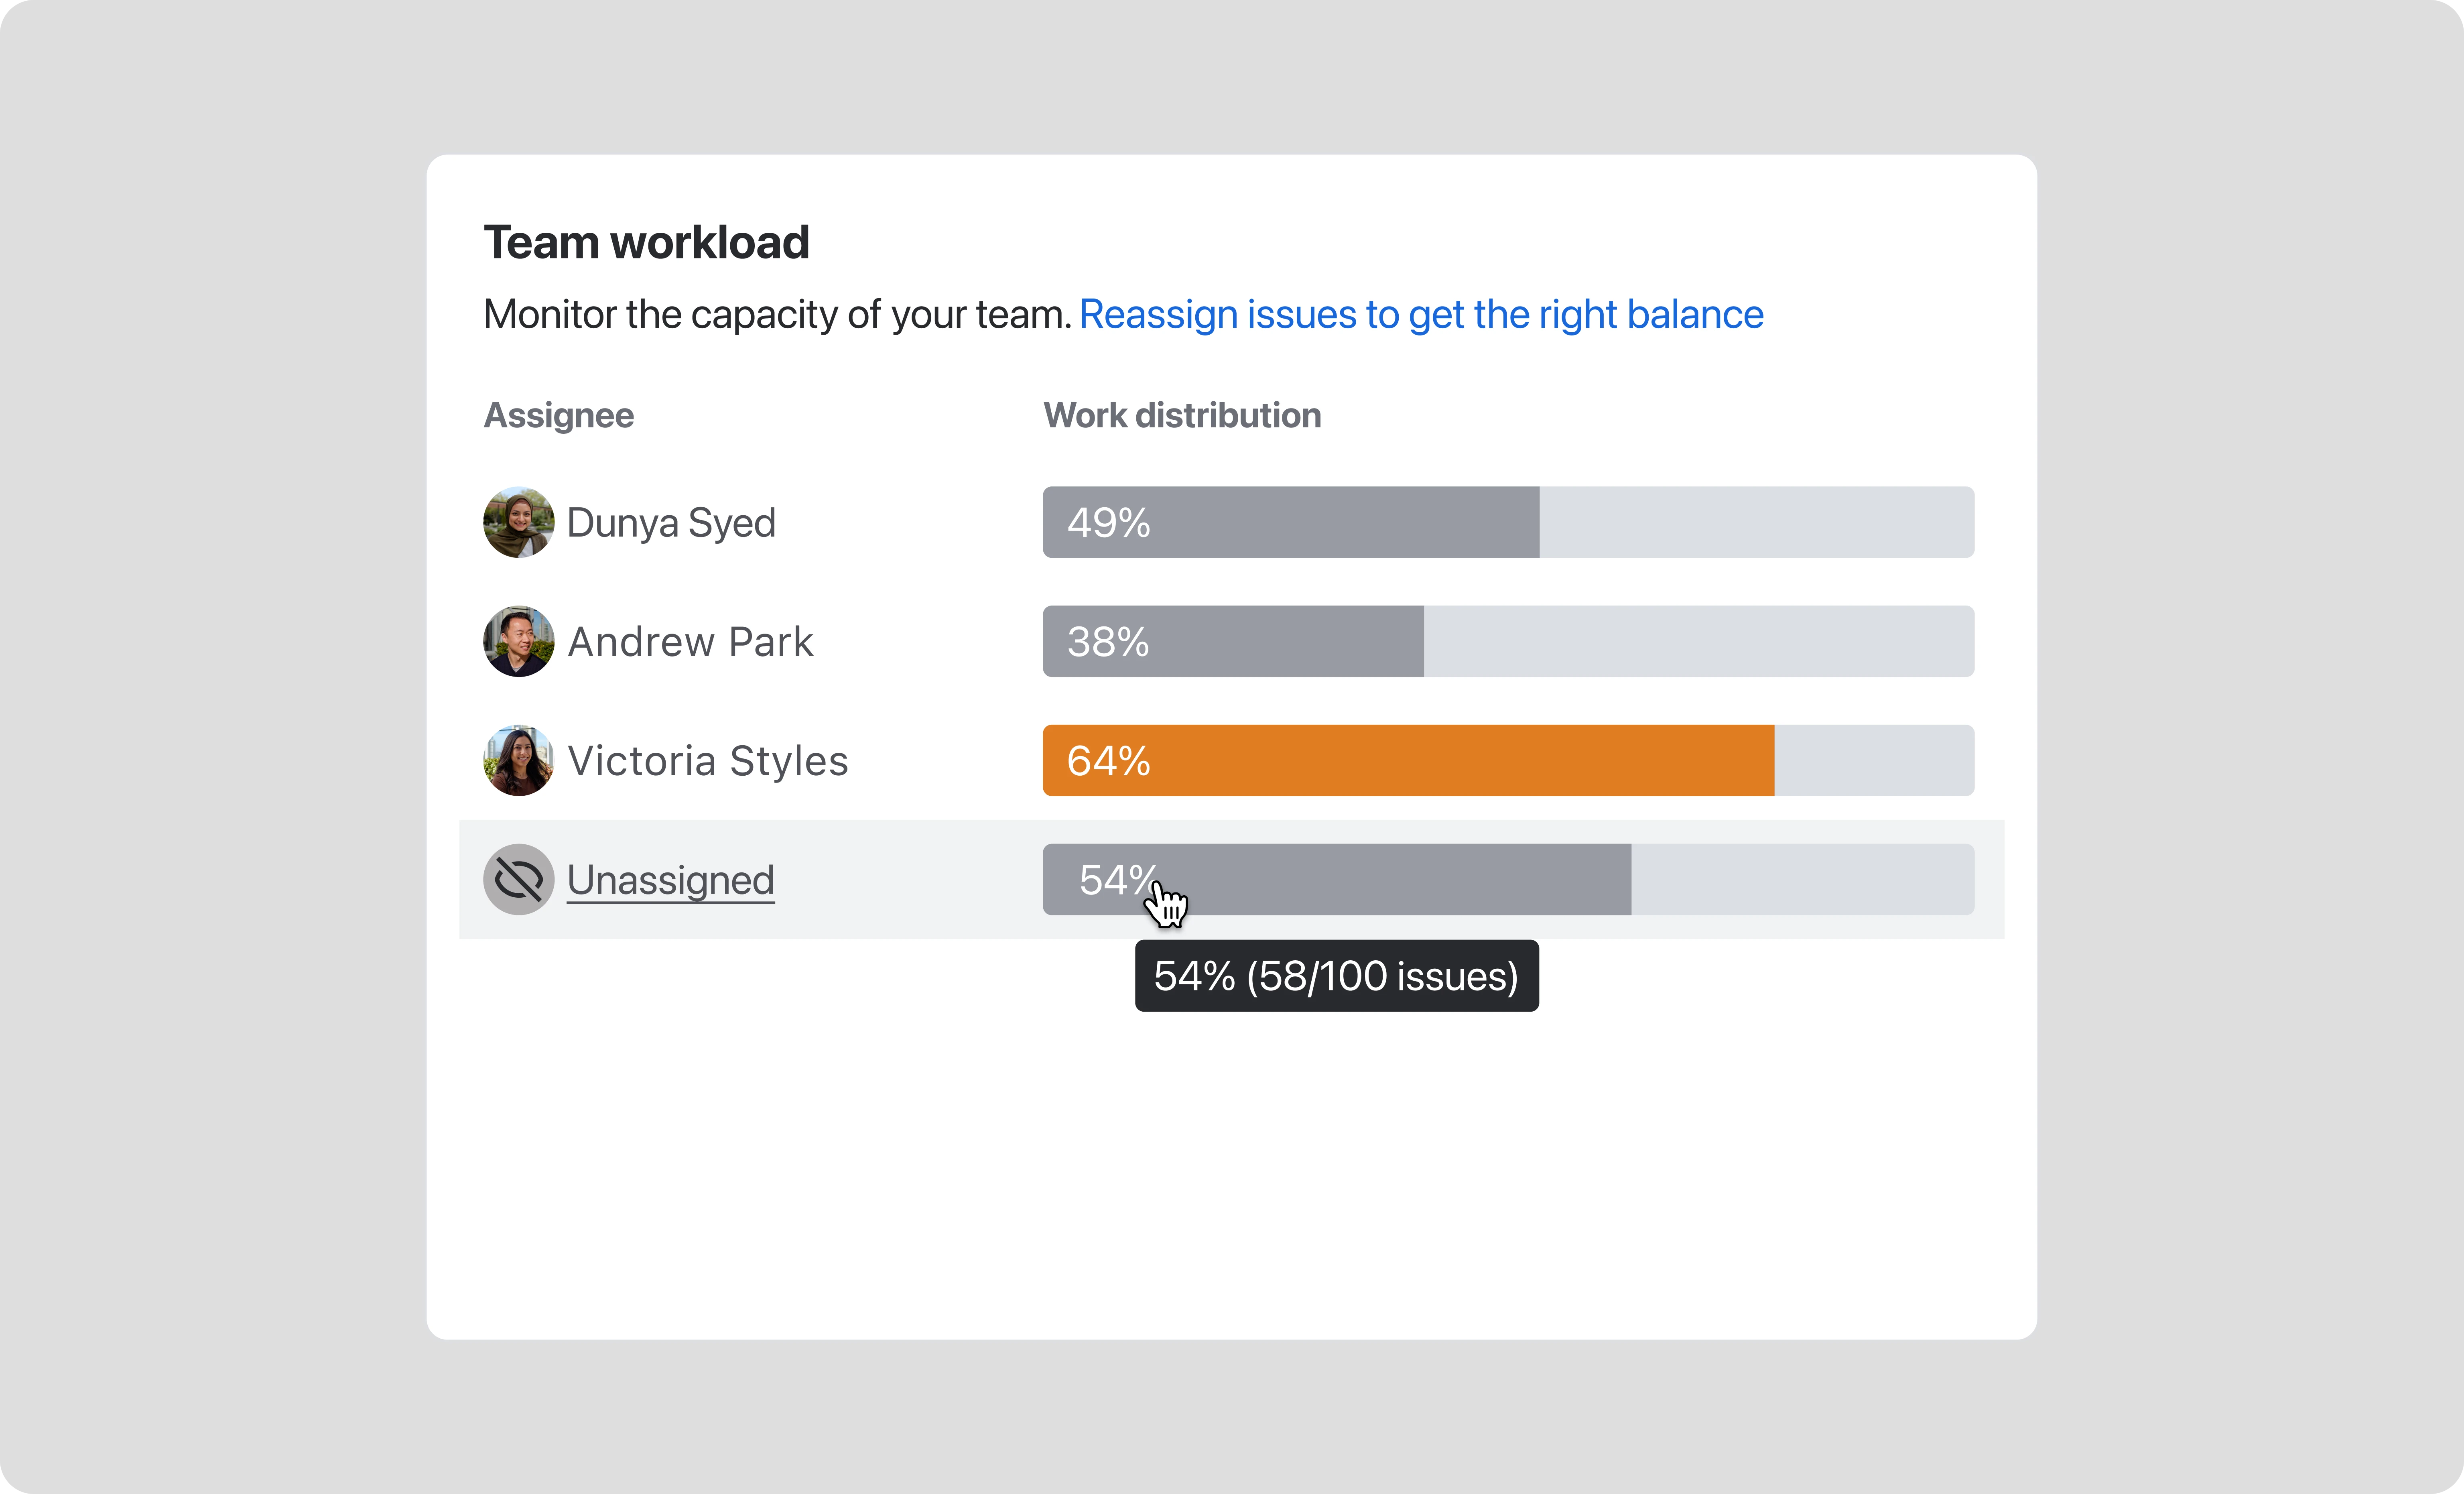
Outcomes
Great outcomes for the first milestone!1.2 million unique views
The page rapidly became a primary destination for users to understand their project status.
15% click-through rate
High engagement proves that users are finding the surfaced insights relevant and actionable.
6th most viewed page
Within a short period, the Summary Page became a top-tier surface in the Jira ecosystem.
Streamlined oversight
Teams now realise their progress in real time within a native, trusted workspace.