How bringing charts into Jira's list view drove a 2.9% uplift in work item updates
Problem
Wasting time on exporting
The reality was that Jira’s reporting was historically too rigid, forcing teams into a broken workaround: exporting data to third party tools for manual analysis. Within the problem space, this manual loop was costing users over 50,000+ hours a year. More importantly, the observed behaviour showed that decision making was happening elsewhere, leaving Jira as a static bank of data rather than a workspace that drives team action.
Constraints
A lot of heavy lifting to get quick insights
The challenge was adding functional depth without adding visual weight to an interface that millions of people already find quite dense.
Isolated Insights
The tools to view insights and execute work were disconnected, users faced high cognitive load and outdated data. Charts remained static and far removed from the active work layer, forcing a constant re-export cycle just to ensure analysis reflected the real-time state of work.
approach
Lean Discovery and Decision-Logic
I dived into the discovery phase to understand the problem space deeply while keeping the process lean, as our initial strategy was to roll the feature out as an experiment.
Discovery
My analysis identified that the export behaviour was an embedded workaround for a lack of reporting customisation. Our goal was to solve the disjointed reporting journey by keeping users in-product.
Alignment through Sparring
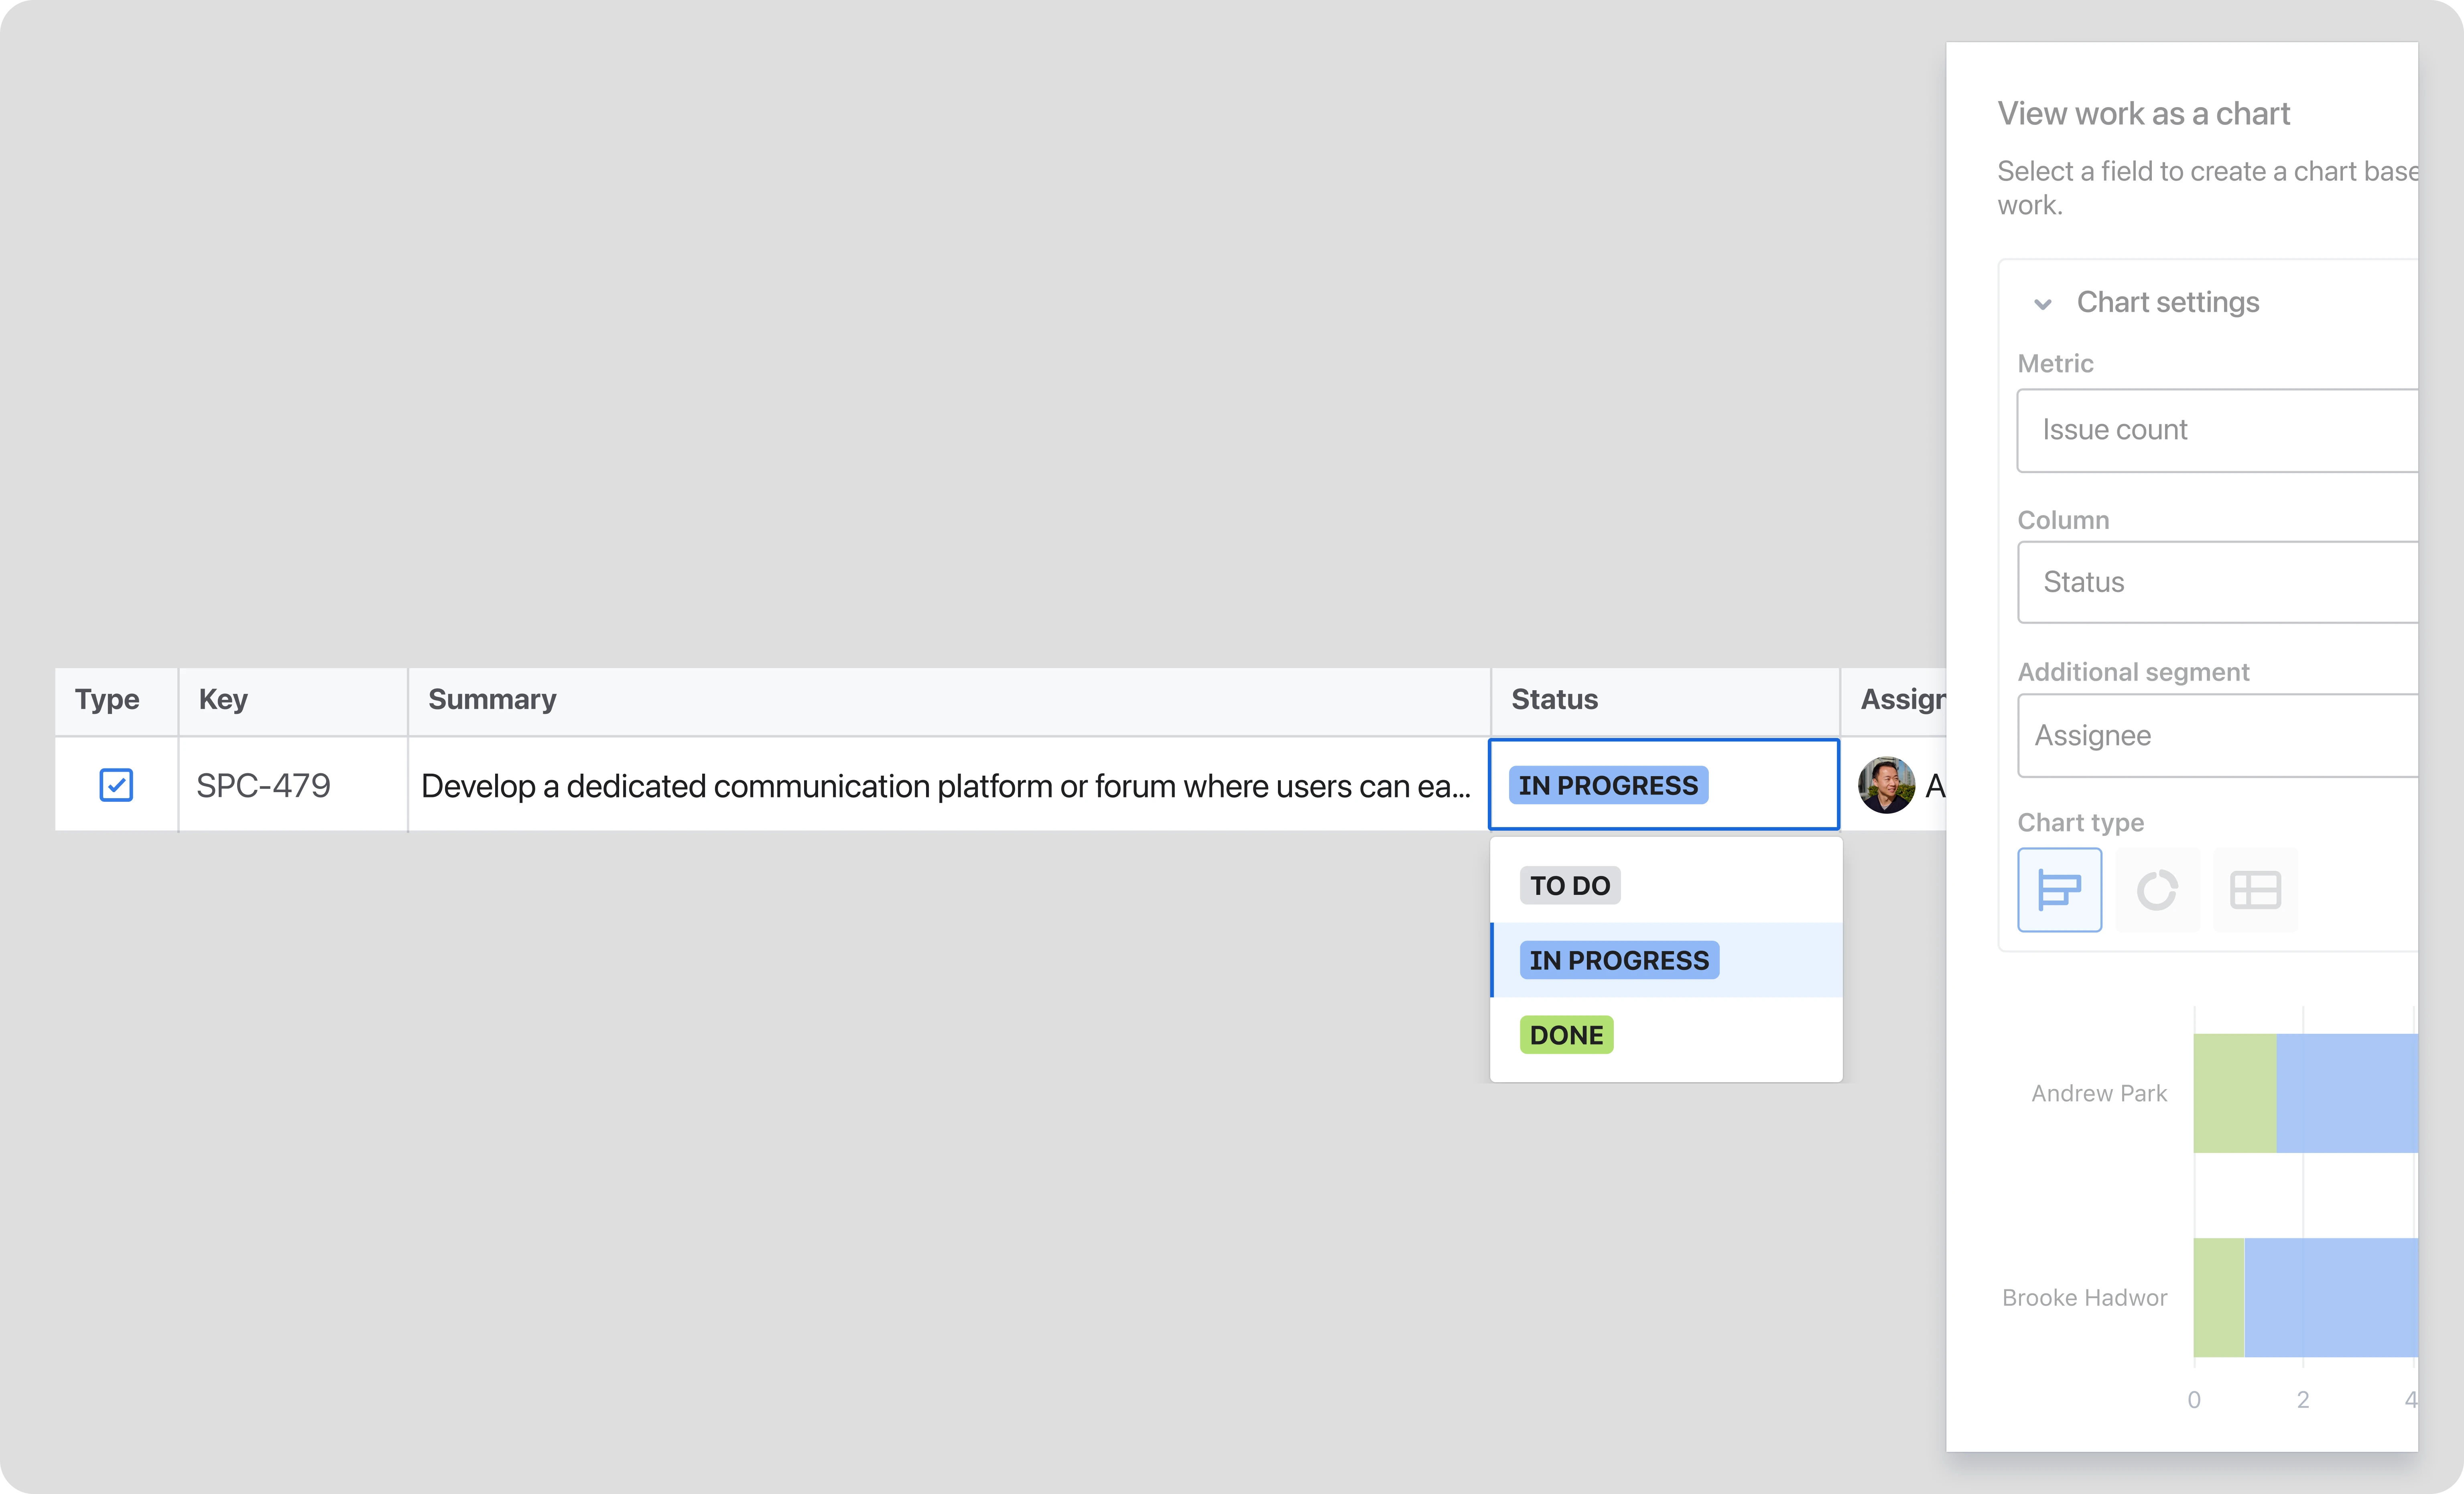
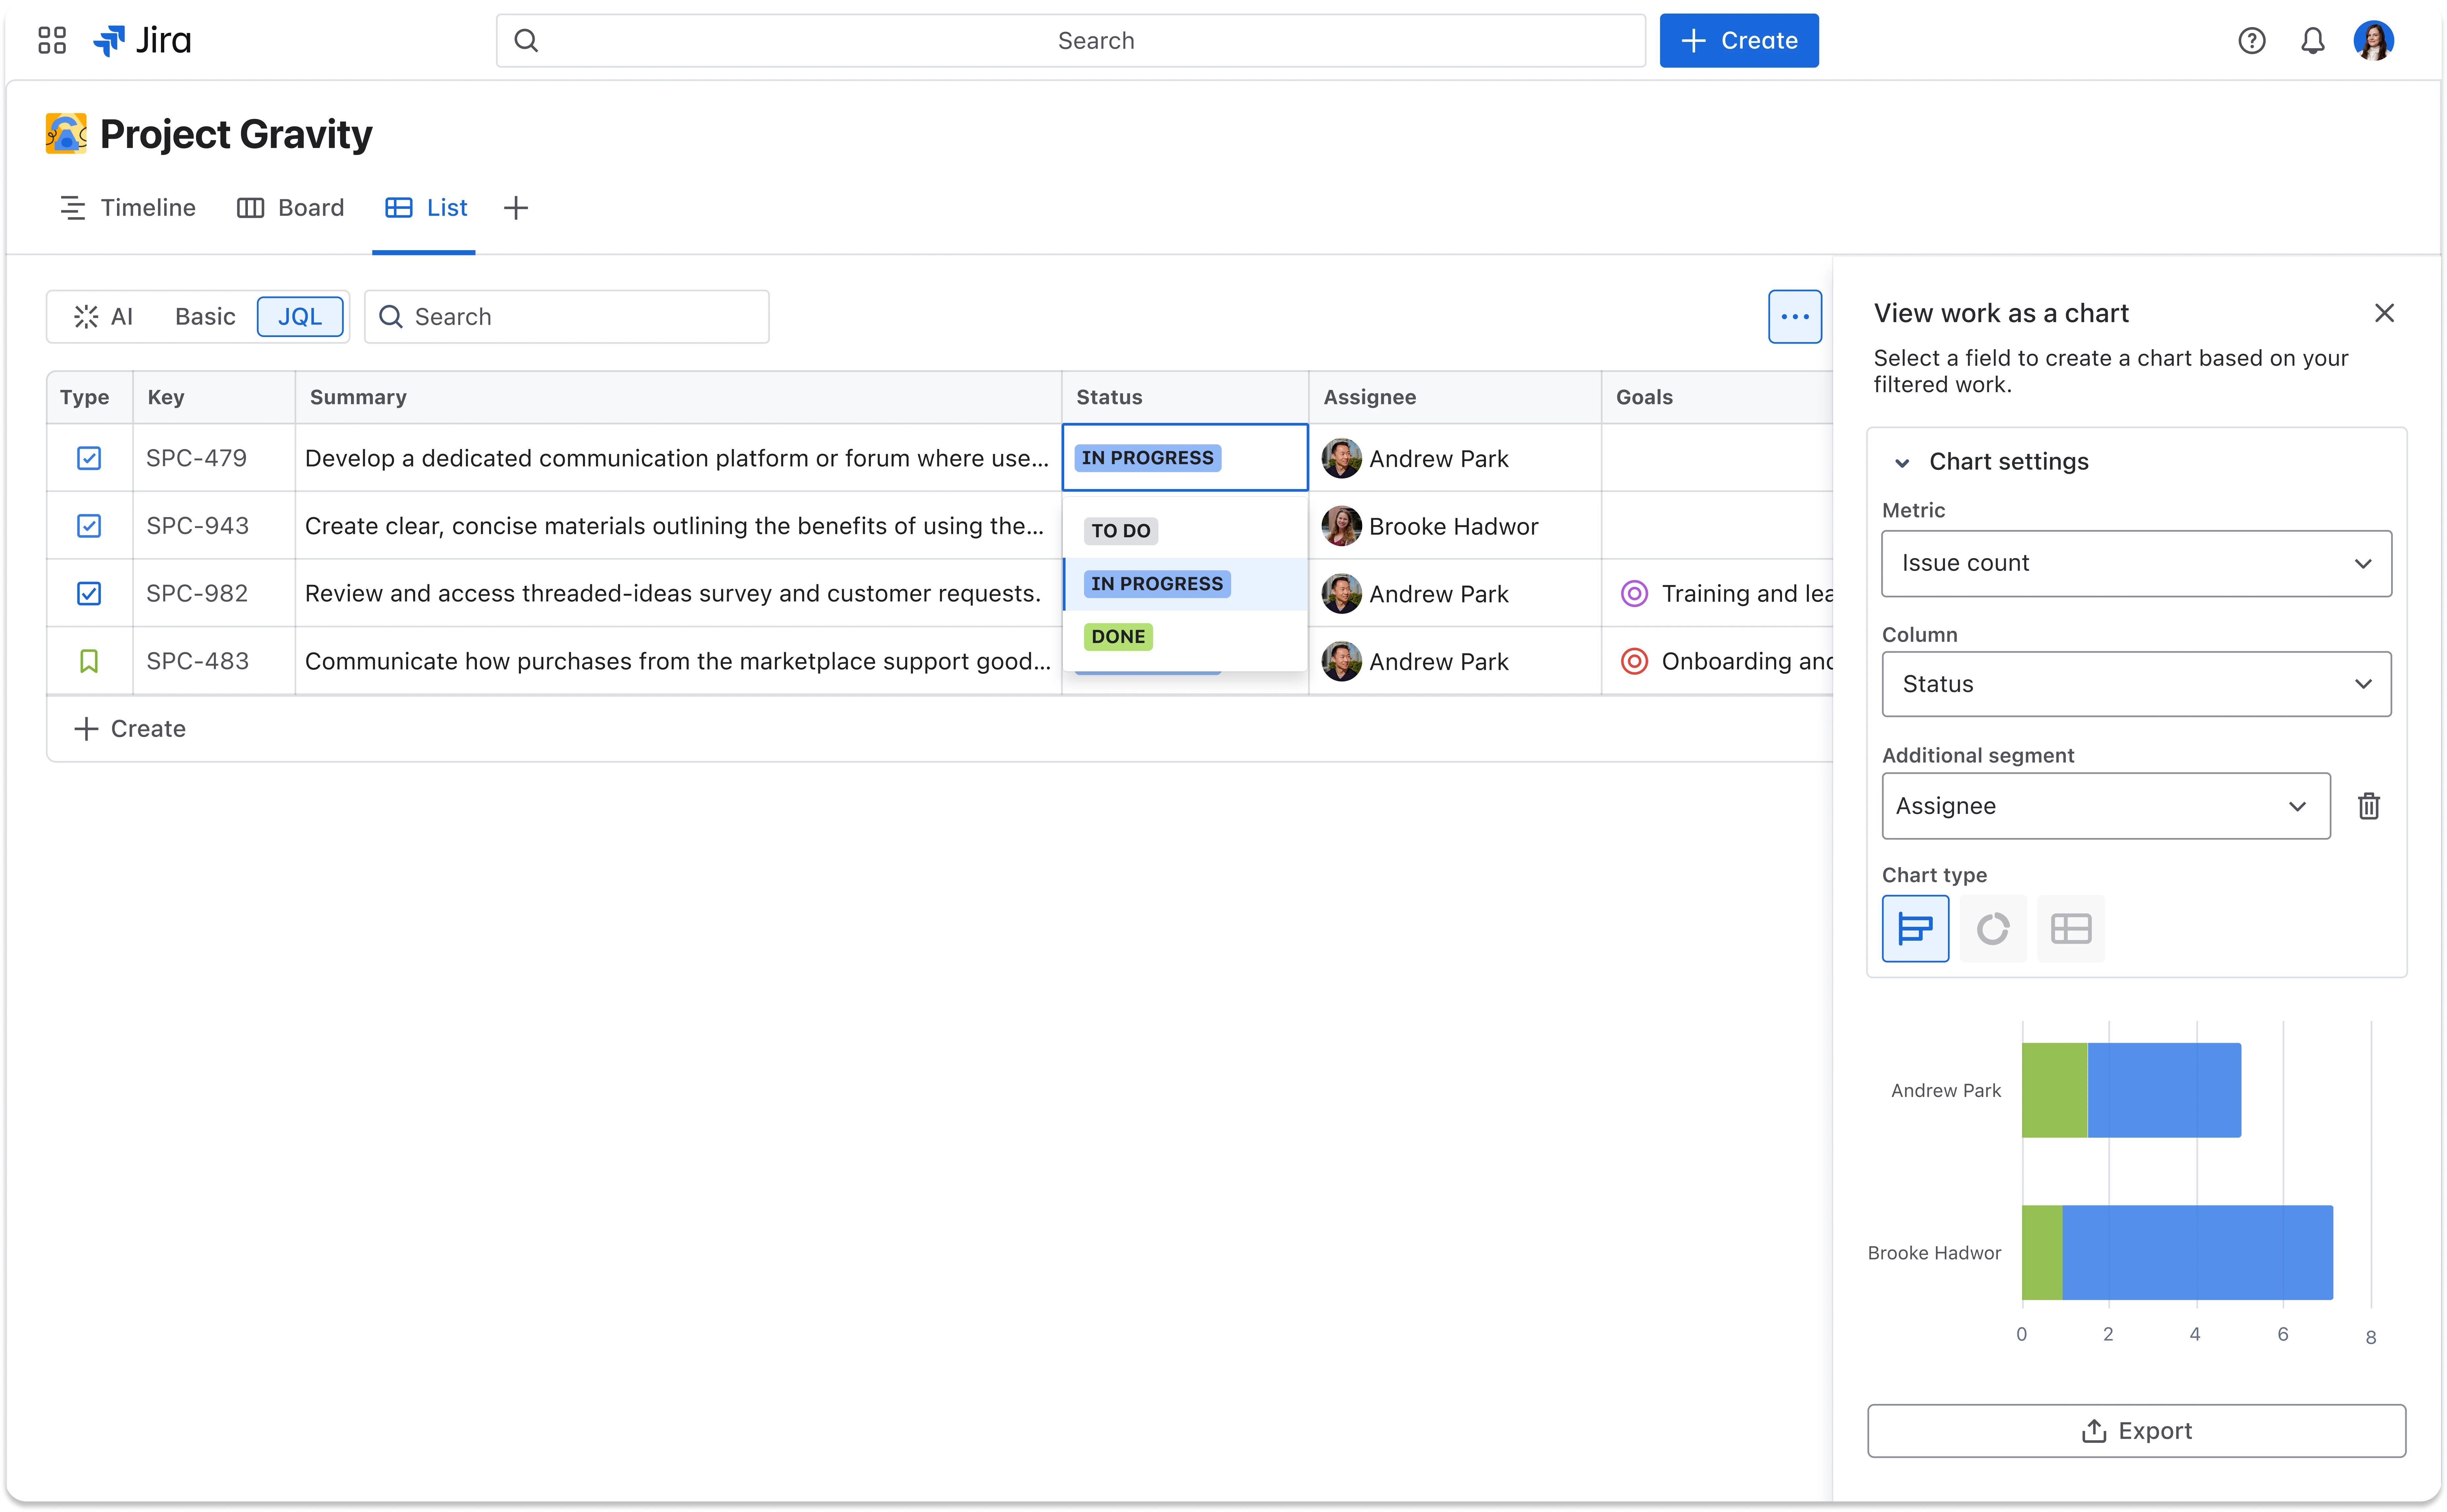
I advocated for a side-panel approach to prioritize context over feature bloat. By keeping the work table and visualizations visible simultaneously, I ensured analysis drove immediate action without forcing users to navigate away.
Modernising via Saved Views
We designed this feature to work with saved views, allowing teams to recreate and save detailed reports within their workspace. Unlike traditional reporting, this provided live interactivity and personalisation, ensuring users had no reason to export their data.
Solution
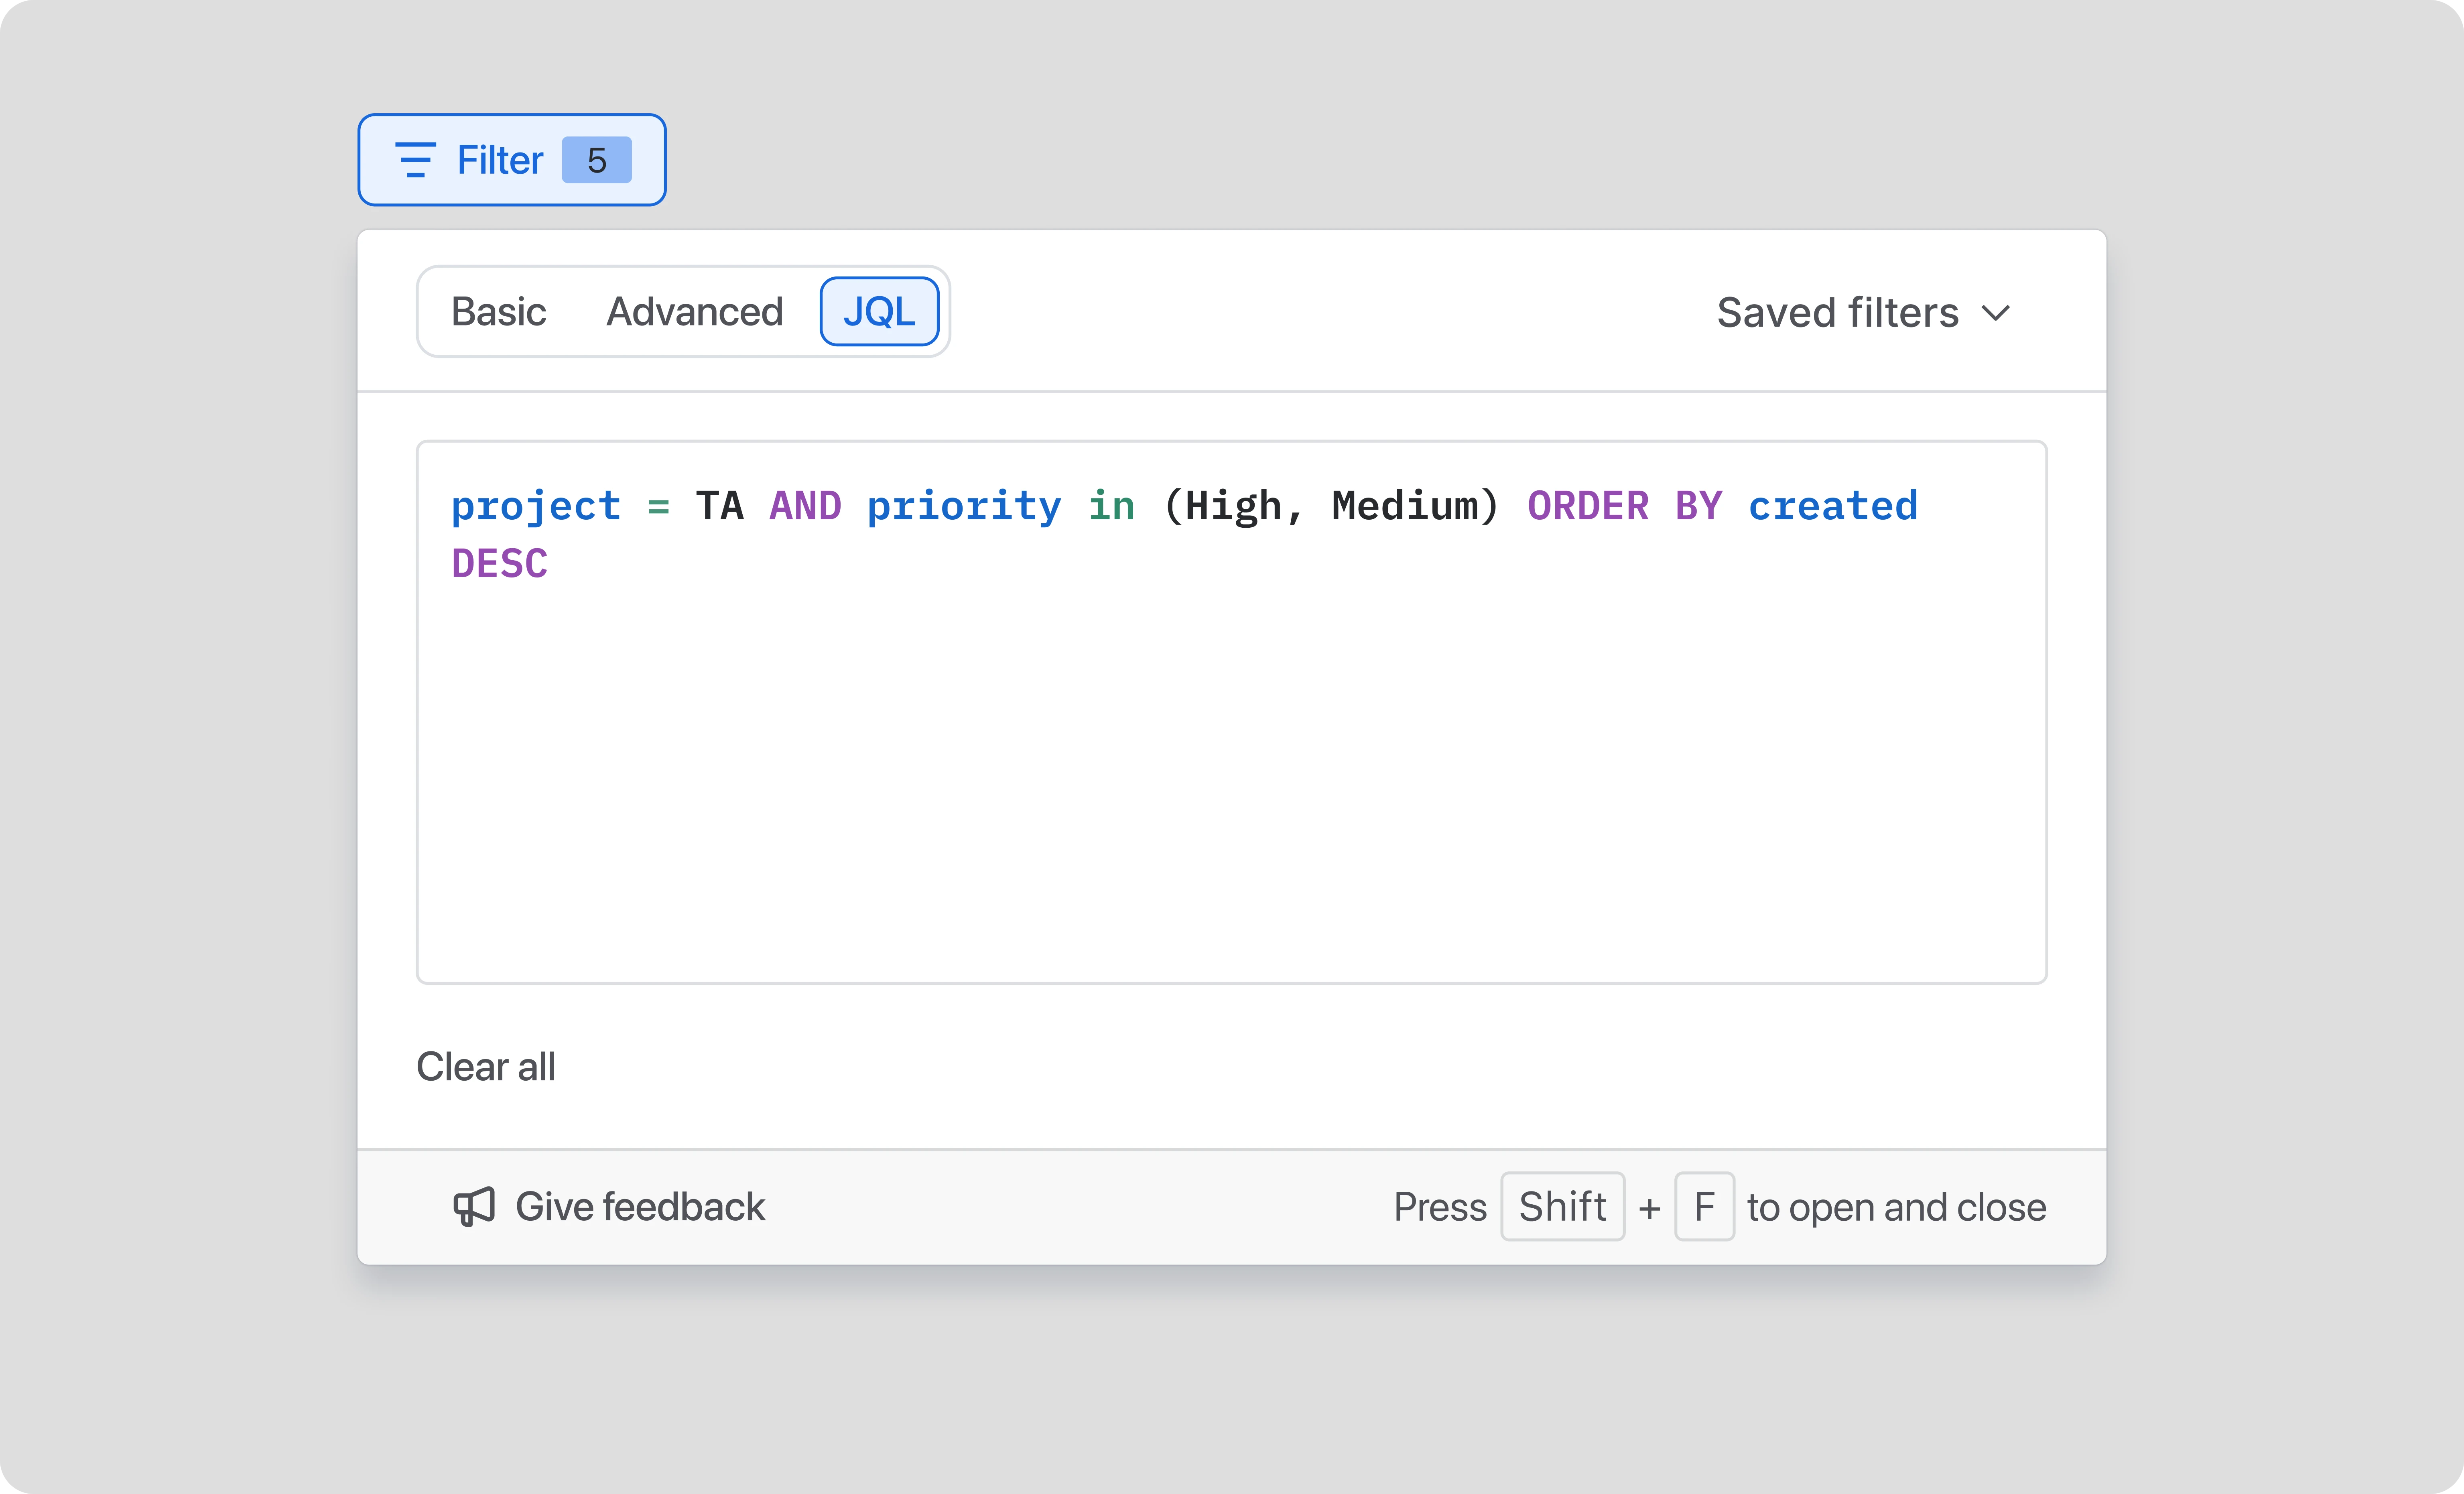
Instant, reactive slicing
Charts update in real-time as data is filtered, enabling teams to "slice" through their work without ever leaving the view.
Unified analysis and execution
By merging insights with the work, users can update tickets alongside real-time data without losing their context.
Flexible visibility
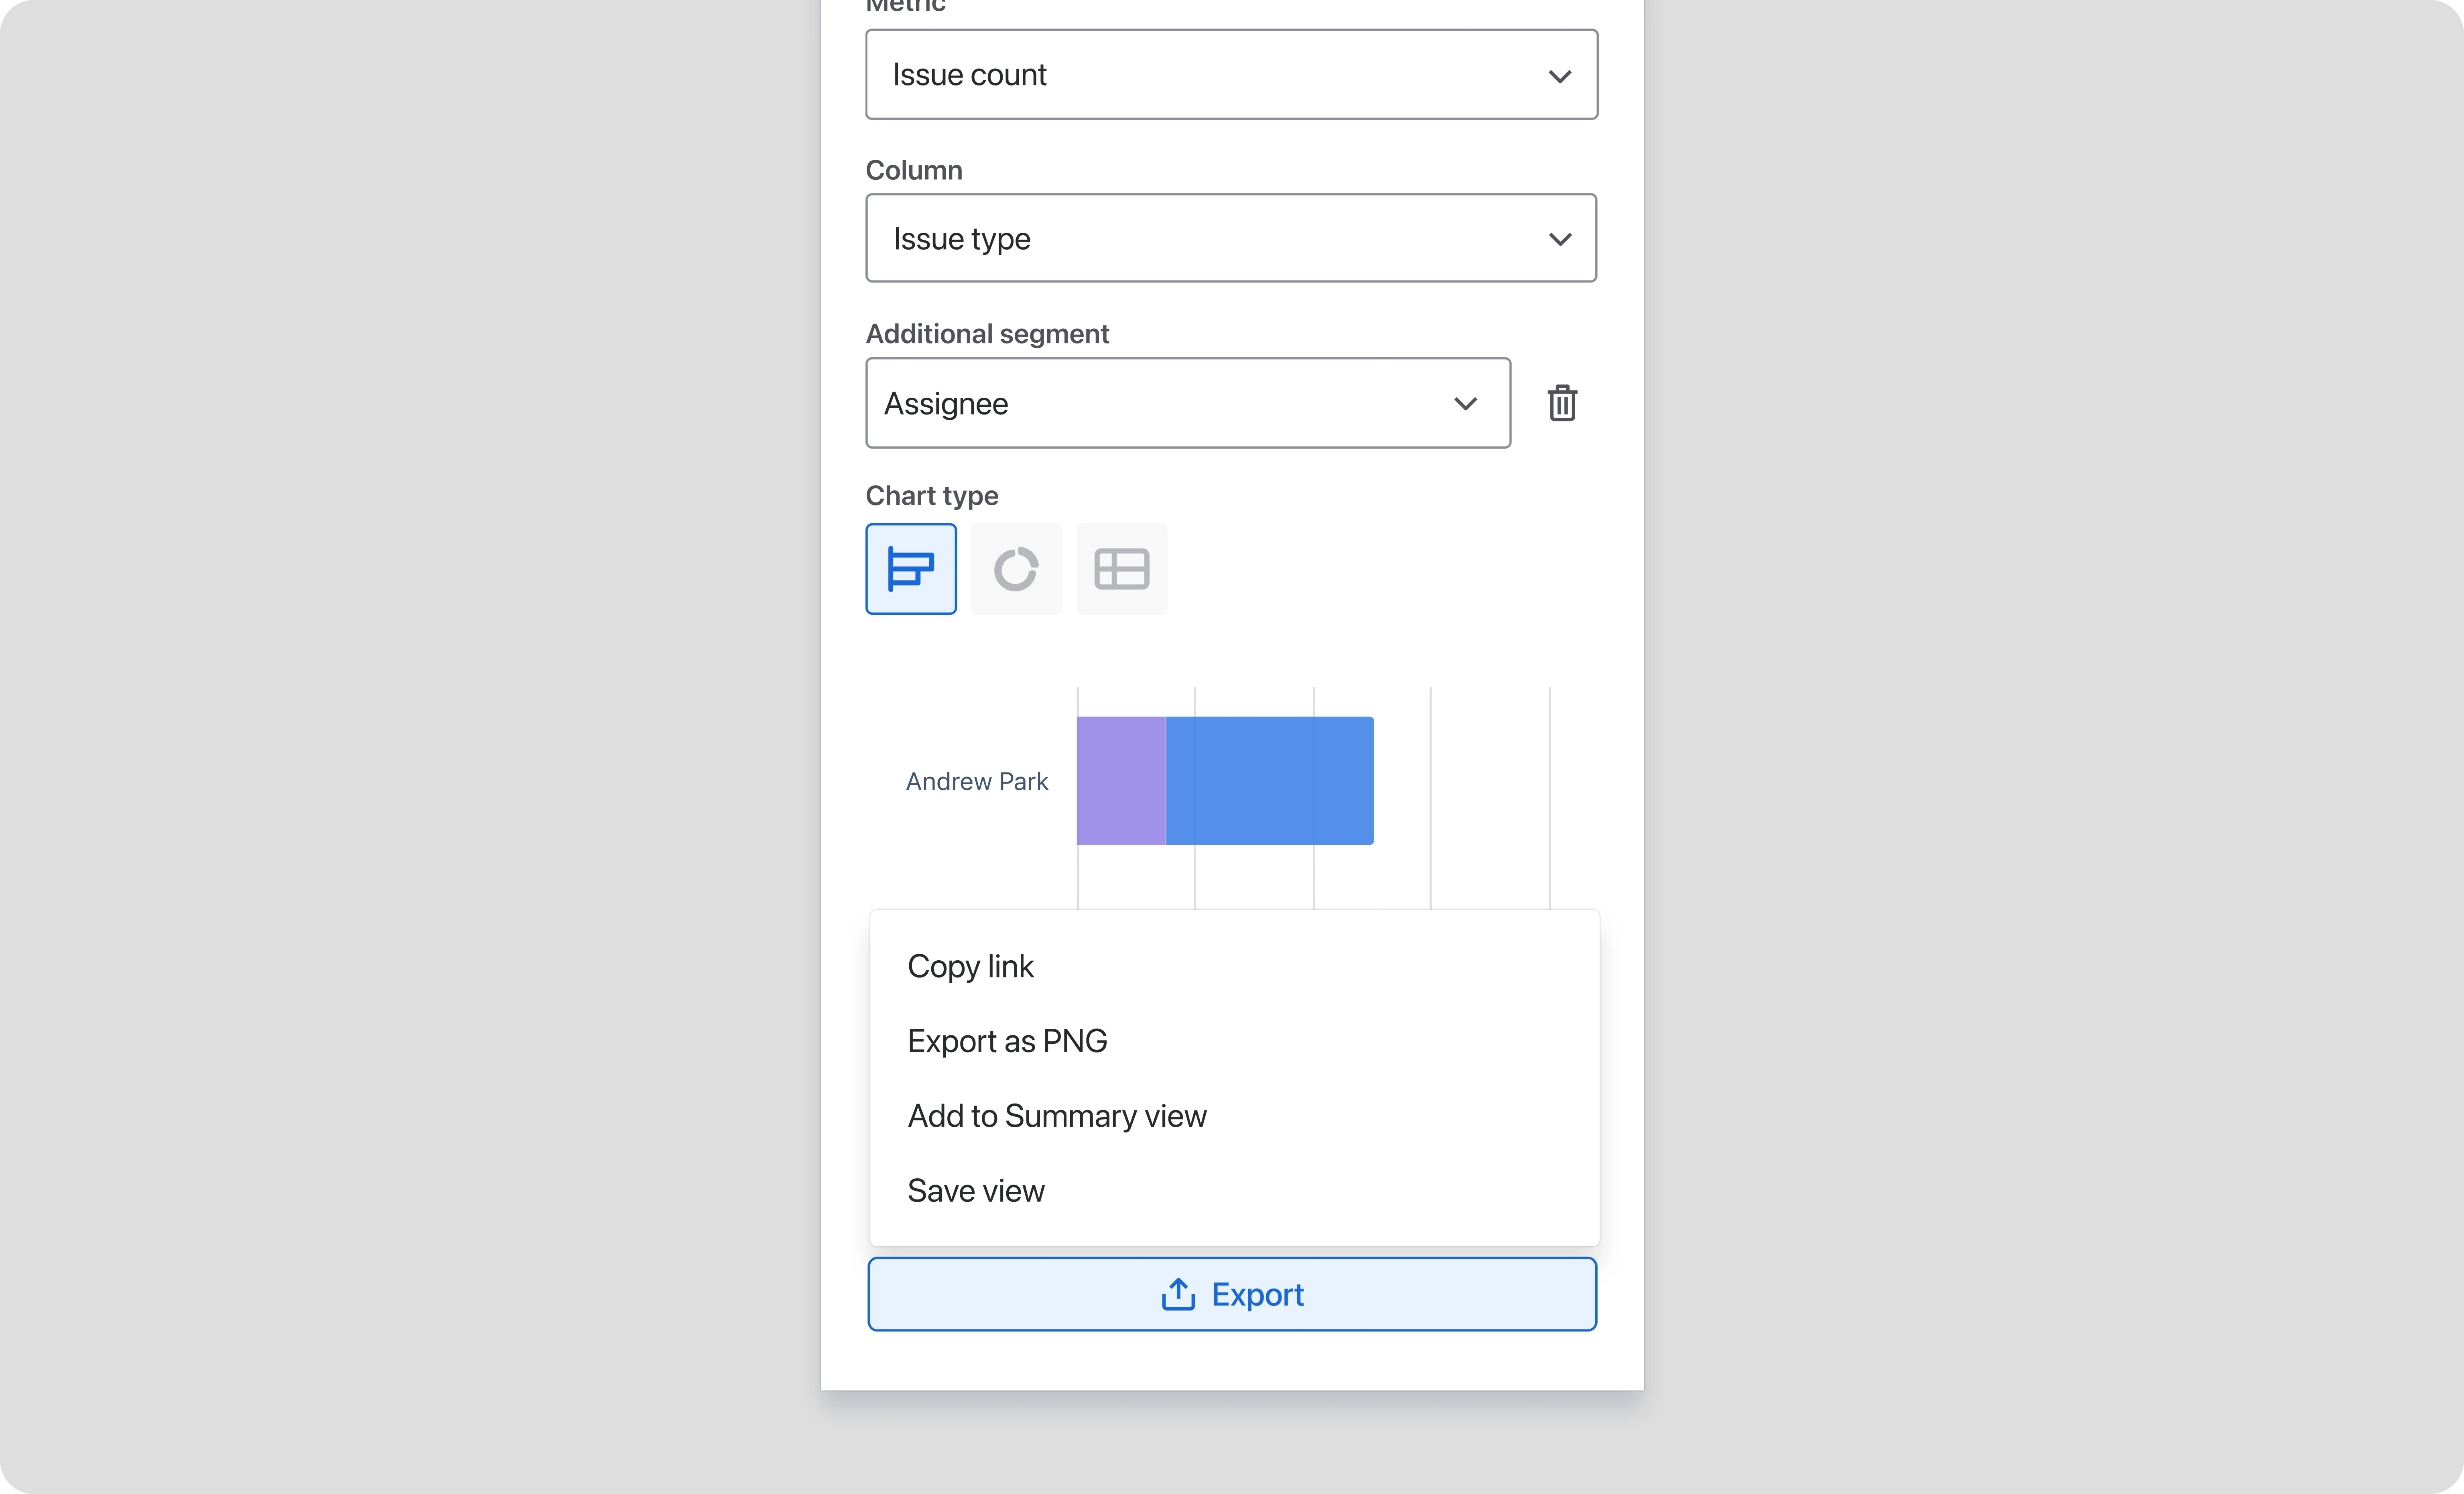
Segmented chart types provide deeper project flexibility and export options, support for external reporting.
Outcomes
By moving from static reporting to an in-context experience, we successfully transformed Jira from a passive data bucket into an active workspace for decision-making.
50,000+ hours saved
Redirecting over 50,000 hours of manual spreadsheet work back into the product, allowing teams to focus on delivery instead of data entry.
+2.9% increase in work item updates
This uplift in core activity proves that in-context reporting made it significantly easier for users to keep their projects moving.
+0.72% rise in comments
An increase in communication signals improved team collaboration and more frequent alignment directly where the work is happening.
Streamlined Decision-Making
Surfacing insights in-context, we removed the friction of switching between tools, turning Jira into a more reliable and efficient workspace.